This Kelvin-Helmholtz cloud phenomenon was spotted from the University of Utah campus MesoWest cameras (looking south). Wikipedia: Kelvin-Helmholtz Instability.
A wave of cold, artic air moved into the United States late in January 2019. Many record cold temperatures were broken. You can search on the news for that.
3-years of HRRR model analyses were used to compute empirical cumulative distributions of conditions for every hour of the year (Blaylock et al. 2018). This image show how much the temperatures at 0700 UTC on 31 January 2019 are less than the 5th percentile for the same time of year. This shows that temperatures are much more than 10 degrees colder than the 5th percentile temperature.
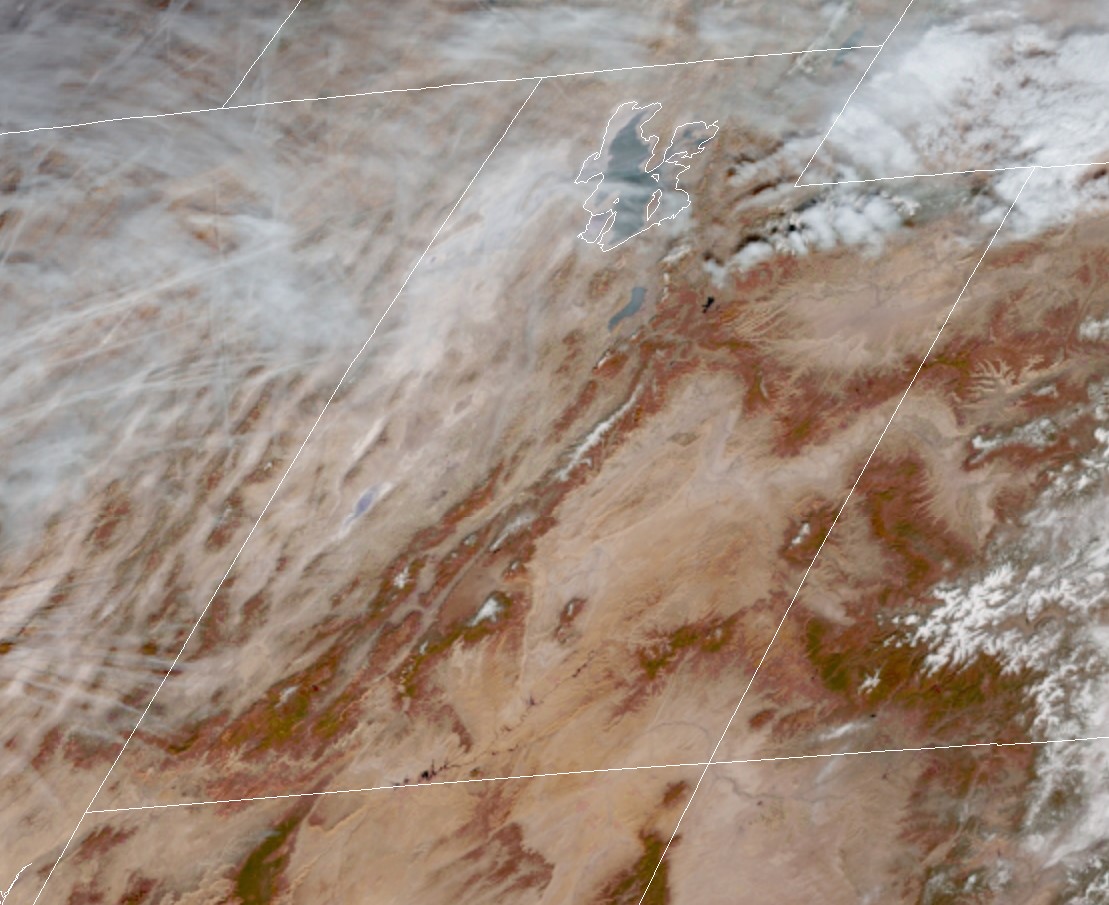
Several punch clouds occurred over Salt Lake City on January 29, 2019. The altocumulus cloud layer is made of supercooled liquid cloud droplets. When an ice particle is introduced, probably by an aircraft, ice crystals grow rapidly at the expense of the liquid droplets. This results in ice fall streaks that fall out of the cloud and leaving a hole behind. More info at Wikipedia: Fallstreak Cloud.
I created a True Color RGB image for all GOES-16 data files between 1800-1820 UTC for the month of September 2018. Then I plotted an image for different RGB percentiles. Looks cool.
Notice the differences between the 0th (minimum) and 1st percentile. Those dark spots are caused by cloud shadows.