Tuesday, September 30, 2014

HRRR Model Operational Today!

The High-Resolution Rapid Refresh model, or HRRR, is operational today! HRRR creates a 15 hour forecast every hour, so it's a good product to look at when forecasting short term precipitation. 

You can view HRRR forecasts and other forecast products at mag.ncep.noaa.gov

Looks like we'll have some showers along the Wasatch Front later this evening:


Model
High-Resolution Rapid Refresh (HRRR)

Version
V1.0.4

Implementation date/time
September 30, 2014, 14Z

Purpose 
The HRRR is a high-resolution model that is run hourly to 15 hours over a domain that covers an area slightly larger than the contiguous United States.  The HRRR provides forecasts, in high detail, of critical weather events such as severe thunderstorms, flash flooding, and localized bands of heavy winter precipitation.   Since the HRRR is run hourly and assimilates many data sources including radar reflectivity data, the HRRR helps provides critical details to forecasters in rapidly-changing and evolving weather events.   The HRRR will also eventually become part of a high-resolution ensemble system, and it will be used to help create a first guess for the Real-Time Mesoscale Analysis.
Changes being made for this release
Initial implementation of this model
Developed by
NOAA/OAR/Earth Systems Research Laboratory

Runs on
The National Weather Service (NWS) Weather and Climate Operational Supercomputing System (WCOSS)
Community software 
Weather Research and Forecasting (WRF) model - ARW core

Input 
Rapid Refresh (RAP) model data and various observational data sources, featuring 15 minute radar reflectivity data.
Output and where to find it 
The HRRR runs hourly and produces output every 15 minutes from 0 to 15 hours.  Gridded output on a 3km CONUS grid and station time series BUFR data are sent to www.ftp.ncep.noaa.gov/data/nccf/com/hrrr/prod/hrrr.*, where * is the year, month and day, and also to NOMADS.  Hourly output on the 2.5km CONUS NDFD grid is available on NOAAPORT.  WMO headers can be found at http://www.nco.ncep.noaa.gov/pmb/changes/hrrr_wmo_headers.shtml .  Imagery from the HRRR is available on the Model Analysis and Guidance (MAG) webpage at mag.ncep.noaa.gov .

Primary users 
NCEP Service Centers, FAA, NWS offices (except those in Alaska and Pacific regions), NOAA labs, various private sector companies including the wind and solar energy sectors, and forecasters - especially those concerned about convective evolution.
In the future 
The next version of the HRRR will have various upgrades including changes to address current warm dry daytime bias in warm season and cold bias in cool season.   It will also feature various WRF updates and enhancements to the assimilation of radar reflectivity and other data.   Plans are to eventually expand the HRRR to cover Alaska
 

Saturday, September 27, 2014

Fall is Here, and it came Wet!

The first day of Fall was a few days ago, but today we are realizing what that means. Our first autumn storm is here, and it's raining a lot! When the clouds clear out we'll likely see some white stuff capping the mountains. 

The rain started last night and has been nearly non-stop since. This chart shows the accumulated precipitation in Spanish Fork over the course of the storm:
Yep, over an inch of rain and it's still coming down! And it's coming down like that along the entire Wasatch Front.
Source: National Weather Service Enhanced Data Display
This storm is pretty widespread. One of my friend's brother and my cousin were in a high school band competition in Payson and got soaked. I imagine those high school students created many memories today.
Source: Weather Underground
This rain is not like the scattered summer thunderstorm. But there is a lot of lightning from these clouds:
Lightning Strikes in last 24 hours.
Source: lightningmaps.org
This storm is associated with a long wave trough bringing moisture form the north Pacific. The trough will become a cut-off low on Sunday and will stick around until Tuesday. Compare the two maps showing dynamic tropopause on Saturday and Sunday:
Trough on Saturday
Cut-off Low on Saturday
This low pressure system will say over the Intermountain West until Tuesday. That means we can expect more rain until that system dissolves. 

Tuesday, September 23, 2014

New Shipment

SpaceX Falcon rocket launches the Dragon capsule
SpaceX's Dragon capsule recently delivered to the International Space Station a shipment of mice, a 3D printer, and a new weather instrument
Dragon attached to Space Station
Source: USTREAM
RapidScat will be installed on the ISS in the coming days. Its purpose is to measure ocean winds. Better observations of winds in the ocean should lead to better weather forecasts. This new and improved instrument replaces the old QuickScat Satellite which was decommissioned in 2009.

When Dragon returns to earth it will bring with it lettuce harvested from the space station.

More information about the mission can be found here:

Also, a NASA news article here:

In similar news, SpaceX and Boeing were both awarded contracts to transport people to space, putting America back in the business of space travel.
Boeing CST-100
SpaceX Dragon 2

Tuesday, September 16, 2014

World Weather Influences Your Weather

From an interview of Louis Uccellini, Director of the National Weather Service, regarding coordinating weather forecasting with other countries:
The weather-climate-water community is a global community. There’s a lot of interaction at various international conferences and the World Meteorological Organization. Many of the models we run are part of the multi-model ensembles that are run and shared among the international modeling centers.
From a day-to-day forecasting perspective, we need a global observing system to drive all our numerical models. Even though people may just be interested in their local forecast, that local forecast is imbedded within a global model, that’s driven by global observing systems and observations provided by countries all over the globe. For the forecasts themselves, we interact with European, U.K., and Canadian centers to share model information that influences our real time forecasts. So these partnerships are extremely important both from a research and an operational perspective, and part of the reason we’re seeing such a dramatic improvement in our extended range forecast is based on the partnerships.
In order to make a weather forecast for a specific area, we first need a forecast for the entire world. After we have a world forecast, we can run a finer scale model for a specific area.

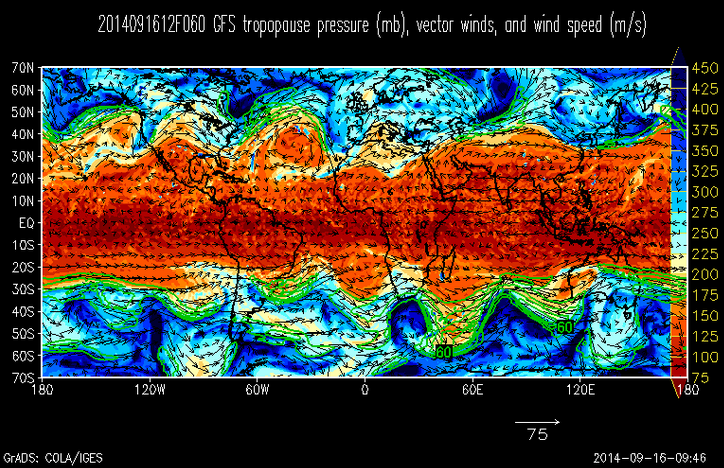
For example, we start with the Global Forecast System (GFS),

Using the GFS as input, we can then run the North America Model (NAM), a model that only covers the United States (shown is the western states).

Using the NAM as input, you can then refine your forecast in a specific location with the Weather Research and Forecasting Model (WRF)

Friday, September 12, 2014

Wind Speeds at Spanish Fork

I've had my weather station in Spanish Fork for about 18 months now. Spanish Fork is famous for it's winds, so I thought it would be interesting to see a long term wind rose for my house. A wind rose shows the frequency of wind speed in a particular direction. Below is a wind rose for March 13, 2013 through September 11, 2014.

As shown below, 23% of the time wind blows from the south-south-east. 19% of the time from the south-east, and less frequently in the other directions. This is caused by out canyon wind (but also because there is a house on both sides of the station). Still, the down-canyon wind is much more frequent than an up-canyon wind. The colors indicate the wind speed of those winds. Very rarely do we have winds that blow more than 10 mph. Most of our winds are less than 6 mph.
I was also curious about how the timing of the down-canyon wind. When does it start and when does it stop. Below is plotted another wind rose, but the coordinates, instead of wind direction, is hour. The color still shows the wind speed. Notice the more warmer colors on the right side of the graph. From this we see the strong canyon winds blow during the morning hours. They are especially strong between 3:00 and 9:00. After 9:00 the frequency of strong winds drop. I usually tell people new to Spanish Fork that the wind usually stops around 10:30 in the morning, and this graph confirms that statement. After 10:30, winds above 5 mph are fairly infrequent. Also notice the bulge of blue around 19:00 (8:00 PM). Calm winds less than 1 mph are very common. This is during the transition between up-canyon and down-canyon wind flow. 

Bottom line from this quick analysis, when someone asks about the winds in Spanish Fork, say the canyon wind tends to end around 10:30 in the morning. The evenings are pleasant with little or no wind.

One thing we can learn from this is the ideal time to water your lawn. The best time would be in the evening around 9:00 PM. Since there is little to light wind, the water won't blow onto you sidewalk.

Good site for travel ideas and things to do in Utah

I'll post this so I don't forget about this website:
http://www.willhiteweb.com/utah_sights/what_to_see/visit_192.htm

"But it's too early for snow!!!"

Here we are nearing the first day of fall, enjoying the leaves change colors...wait, why are the leaves white??
EarthCam.com

Tuesday, September 9, 2014

It's raining...a lot

Everyone is walking into school drenched.

My entire institute class is waiting or our teacher to arrive. Apparently there is an accident on Foothills Drive. The roads sure look wet there...

Our station at the Mountain Meteorology Lab at the University of Utah shows nearly half an inch of rain after 8:00 AM. And it's still raining! But it should pass by the time I have to walk across campus.

Lightning from the Mountain Met Lab...

And another lightning picture from WBB...

Monday, September 8, 2014

Lots of rain, all over the state

Lots of moisture, and lots of convection
wunderground.com/radar
And this is the NAM analysis for noon today (four hours before the above radar)...The orange color in the top right shows CAPE, or the energy available to raise air parcels and initiate thunderstorms. Expect more of this tropical moisture tomorrow!
weather.utah.edu

Saturday, September 6, 2014

Hurricane Norbert

I like this picture. Yeah, there is a hurricane, but look at all the open-cell cumulus clouds to the top-left! Yum! Open-cell convection is an indicator of cold air advection.

Norbert is riding up the coast of the Baja Peninsula. It's expected to weaken to a tropical storm before making landfall making landfall south of the California-Mexico boarder.

Utah should get some of the moisture from this storm. Southern Utah is expected to receive over and inch of rain between Sunday and Tuesday. Below shows the SREF (Short Range Ensemble Forecast) for 24 hour precipitation greater than 0.25 inches. Looks like Zion National Park area is most likely to receive the bulk of the rain. Watch out for flash flooding. Other parts of the state have a lesser chance of heavy rain, but don't be surprised when you see the dark clouds.

Friday, September 5, 2014

Thursday, September 4, 2014

Utah Air Quality Research

This is work being done in my research group at the University of Utah: Also, an article about the Utah Transit Authority's (UTA) ozone sensor on the Red TRAX train http://www.rideuta.com/news/2014/08/air_quality/

Wednesday, September 3, 2014

Hiked Santaquin Peak. "I can't see the other mountains!"

The forecast today was warm and sunny. Not a cloud in the sky. Just a perfect day for a hike. At the top of Santaquin Peak, located on the south end of Utah Valley, we saw a thick layer of brown haze and smoke that filled all the valleys bellow us. It looked like someone had put a lid over Utah keeping the pollution from diluting with the clean air above.
 There must be some stable air mass above us. Sure enough, a glance at this morning's sounding shows a thick stable layer above. It would be pretty difficult to make convective clouds in air like this. That is why we didn't see any clouds in the sky today
 
The interesting thing about this pollution was how much area it spread. Usually we expect to see high levels of pollution near the cities, but even the unpopulated mountain valleys were fumigated with nasty air. This dirty air must have come from somewhere else... and it did. There are several fires in the Northwest. The one shown below is in northern California:

Source: NASA Aqua Satellite, August 31, 2014
And here are some pictures from our hike...