
Thursday, July 30, 2015
This is art: HRRR temps
Been working with WRF for my master's research and I thought this was really pretty...surface temperatures of the western states on April 20, 2015 at 6:00 PM mountain time. There are no state lines, but you can locate California's hot Central Valley (orange/red), the Snake River plane of Idaho (yellow), the cool Rocky Mountains (magenta). Can you pick out where the Great Salt Lake is?

Monday, July 27, 2015
Dusty Day
This morning a passing cold front kicked up a lot of dust. This is the PM 2.5 concentration at the Mt. Met. Lab at the University of Utah.

A look at the NAA camera shows just how dusty it got. This morning was clear...

Then the dust blew in around 10:00 AM

Then you couldn't see the mountains

Looking at the MesoWest observations at 11:05 shows winds gusting in the 40s from the northwest. Pretty wild.

Thursday, July 23, 2015
Great Salt Lake Summer Ozone Study (draft for grad news)
Clean air is important to our respiratory health.
Unfortunately, some areas in Utah often observe unhealthy levels of ozone
pollution. While ozone occurs naturally in the upper atmosphere and absorbs
harmful ultraviolet radiation, smog-forming ozone created near the surface by other
pollutants in the presence of sunlight poses a danger to human’s respiratory
health.
This summer a team of atmospheric science students and
professors at the University of Utah, Weber State, and Utah State worked together
with Utah’s Division of Air Quality to understand how the Great Salt Lake influences
ozone concentrations in Northern Utah. The purpose of the Great Salt Lake
Summer Ozone Study is to better understand the generation and transport of ozone
pollution in northern Utah, particularly areas around the Great Salt Lake.
To accomplish this, graduate and undergraduate students at
the University of Utah participated in three intensive observation periods in
which ozone levels and weather conditions were measured around the lake. Ozone
monitors are installed on a UTA TRAX train, the KSL helicopter, and over twenty-five
stationary sites which collected ozone and weather information all summer.
Other mobile observations were made from trucks and the University’s
“Nerdmobile” while driving routes around the Great Salt Lake. Preliminary
analysis of the data collected has already shown interesting trends in ozone
concentration around the lake. With this many observations researchers can
understand how ozone concentrations change over a day and where the highest
levels of ozone occur. This new knowledge will be used to improve air quality
forecasts.
More information about the Great Salt Lake Summer Ozone
Study can be found on the project’s website at http://meso2.chpc.utah.edu/gslso3s/.
Current air quality forecasts issued by the Division of Air Quality can be
found at http://air.utah.gov/forecast.php.
Monday, July 20, 2015
Good air quality next few days
Several moist weather disturbances passing through Utah this week will stir the air up enough to keep our ozone pollution at healthy levels this week in most areas. Look at the most current air quality forecasts here: http://air.utah.gov/forecast.php?id=slc

This morning has been rainy with tropical moisture coming up from the south west as remnants of a hurricane move into the states. The HRRR model suggests these widespread showers pass the Wasatch Range by the afternoon. The wet ground will keep our temperatures cooler than usual today with the cloud cover and as more afternoon heating goes to the latent heating by evaporating water rather than heating the air. Below shows the modeled radar reflectivity for 2:00 PM today.


This morning has been rainy with tropical moisture coming up from the south west as remnants of a hurricane move into the states. The HRRR model suggests these widespread showers pass the Wasatch Range by the afternoon. The wet ground will keep our temperatures cooler than usual today with the cloud cover and as more afternoon heating goes to the latent heating by evaporating water rather than heating the air. Below shows the modeled radar reflectivity for 2:00 PM today.

Thursday, July 16, 2015

Wednesday, July 15, 2015
Summary of June Ozone in Northern Utah
As part of the Great Salt Lake Summer Ozone Study, we have put together a summary of June Ozone statistics. This bar chart shows the number of stations that observed an 8-hour average over 75 ppb (in blue) and 65 ppb (in orange). The current EPA attainment standard is 75 ppb, but is expected to be lowered.

June ozone was highest during the hot weeks when a persistent ridge was camped out over Utah, giving us mostly clear skies and hotter than normal June summer days. Ozone pollution tended to clear out after rain events. As you can see, there several periods when ozone pollution was over the EPA's health standard. When the health standard is lowered, more days will be classified as unhealthy air. This will be a challenge for Utah and many places in the United States dealing with high ozone as they come up with strategies to improve air quality.
Citizen Science: Volunteer your time to help with Hurricane Research!
Interested in weather and like looking at satellite images?? Or maybe you just like hurricanes. With a little time, you can provide some valuable information to hurricane researchers. Satellites circle the earth several times a day and constantly collect data. Since this is too much data for any group of scientists to look at they need your help! It's really easy to get started, and you don't need to be a weather expert to start helping with this hurricane research. Go to http://www.cyclonecenter.org/ to get started. Simply answer a few questions about images of hurricanes like, "how is this hurricane shaped" and "which hurricane looks stronger?"

Another Satellite Post: Cyclone Global Navigation Satellite System (CYGNSS)
Satellites are pretty cool, and NASA keeps coming with new ideas and technologies that will help meteorologists. These satellites in particular, the Cyclone Global Navigation Satellite System (CYGNSS), will be used to measure winds at the ocean surface and in hurricanes. How will this work? CYGNSS uses GPS signals that are constantly bouncing off the ground! This small constellation of satellites receives the GPS signals and from how distorted these signals are it can determine how fast the winds are blowing at the surface. Cool! Read more about this satellite here: http://earthobservatory.nasa.gov/blogs/fromthefield/category/cygnss/?src=eoa-features

Friday, July 10, 2015
Japans new Satellite
http://nyti.ms/1KUCcqC
Check out this article about Japan's new weather observing satellite!! (several cool animations) The United States is building a new satellite similar to this one.
Check out this article about Japan's new weather observing satellite!! (several cool animations) The United States is building a new satellite similar to this one.

Southern California Jet
Satellite Image July 10, 2015 13:15 UTC

From an email originating from Brian Tang:

From an email originating from Brian Tang:
This is one of the most impressive barotropic breakdowns of a vorticity strip that I've seen. Smoke from the Canadian fires is allowing us to observe this breakdown in the visible band, along with the WV band. Truly a beautiful example of geophysical turbulence and the cascade of big whirls to little whirls.
Double Rainbow
Photo Credit: to Kylee Thurston. Thanks for the amazing picture!
 |
| Double Rainbow in Spanish Fork as seen from near the 1-15/US-6 interchange |
Thursday, July 9, 2015
Gusty winds in Provo Right Now!
Wow! Look at the 52 mph wind gust on BYU campus! I can confirm that observation. My apartment is only a few blocks south of the Eyring Science Center. The trees were bending quite a bit, and a group of those college kids in the parking lot out back were using bed sheets as sails for their skateboards. Also in

The radar showed some widespread rain, and we had a rainbow to prove it was raining, but there were only a few drops on my window.


Large Lightning Storm and Lots of Rain

Last night was the largest display of lightning I have ever seen! Frequent flashes of lightning illuminated the entire night sky.
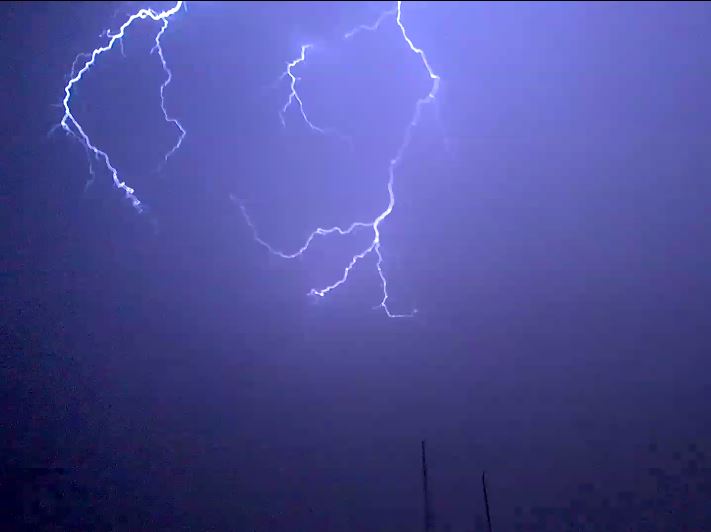


A friend and I drove out to the get a better look. It was strange to see so much lightning right above out heads but not hear any thunder. The sound must have been drowned out by the heavy rain.
We were parked near Utah Lake State Park watching the storm. From the radar it looks like the storm intensified as it moved north into Salt Lake County.
 |
| July 8, 2015 Radar 9:10 PM - 11:20 PM |


CoCoRaHS observations show nearly an inch of rain measured yesterday in parts of Salt Lake county, and farther north saw over an inch. The Salt Lake Airport reported 0.93 inches that fell in a two hour period. The NWS issued a flash flood watch. Even in Provo, there was a lot of rain running down the streets.

The winds last night in Spanish Fork must have been strong because tree limbs about hit the truck out front...


Nothing in the wind observations sticks out to me, except for the 20 mph gusts after 20:00 (8:00 PM)

This event happened on the same day as the NWS reported that 14 people have died by lightning strikes this year, double the amount of last years (read here)
Read about lightning safety here.
Tuesday, July 7, 2015

Summer Thunderstorms
Yesterday's cooler temperatures were welcomed by many. Over the last five days in Spanish Fork we've been in the upper 90s but yesterday we cooled to the upper 80s as a daily high.

It was fun to see the some thunderstorms yesterday. I was outside watching the approaching lightning storm while waiting for the train. The rain drops were really large, and I got on the train just before it started to downpour!


On the way home there was a lot of convection in central Idaho.


It was fun to see the some thunderstorms yesterday. I was outside watching the approaching lightning storm while waiting for the train. The rain drops were really large, and I got on the train just before it started to downpour!


CoCoRaHS show 082 inches of rain on the west side of the valley. I imagine this rain fell over a short period of time.

Last weekend I was up in the Sawtooth mountains and our first night we were treated with a good thunderstorm. Here's the video...
On the way home there was a lot of convection in central Idaho.


Thursday, July 2, 2015
Spanish Fork June 2015 Ozone
Below is a special kind of pollution rose I like to call an "Ozone Clock." This plot was from created with data at the Spanish Fork air quality site at the Airport. Imagine looking at a 24 hour clock with midnight at the top of the clock and noon at the bottom of the clock. AM hours are on the right half of the clock and PM hours are on the left half.
This plot shows the frequency of ozone concentration in Spanish Fork during the month of June, 2015. Ozone is most frequently at at healthy levels in the early morning hours between 6:00 and 9:00 AM. This is the best time of day to do some outdoor exercise. The worst ozone pollution most frequently in the afternoon hours between 15:00 and 20:00 (3:00 - 8:00 PM)

This plot shows the frequency of ozone concentration in Spanish Fork during the month of June, 2015. Ozone is most frequently at at healthy levels in the early morning hours between 6:00 and 9:00 AM. This is the best time of day to do some outdoor exercise. The worst ozone pollution most frequently in the afternoon hours between 15:00 and 20:00 (3:00 - 8:00 PM)
Wednesday, July 1, 2015
Great Salt Lake Summer Ozone Study: Ozone and Wind Roses
NEW Ozone/Wind Rose Interface! Click Here

 Instead of plotting wind speed as a function of wind direction, we can plot ozone concentration as a function of wind direction. These are sometimes called a "pollution rose."
The pollution rose below shows the same June 2015 period at Hawthorne. During the month of June, Hawthorne most frequently experienced unhealthy ozone concentrations when with winds were from the northwest. Air quality was generally good when winds blew from between south and east.
Instead of plotting wind speed as a function of wind direction, we can plot ozone concentration as a function of wind direction. These are sometimes called a "pollution rose."
The pollution rose below shows the same June 2015 period at Hawthorne. During the month of June, Hawthorne most frequently experienced unhealthy ozone concentrations when with winds were from the northwest. Air quality was generally good when winds blew from between south and east.

Figures like this can be created using the interface here: http://meso2.chpc.utah.edu/gslso3s/cgi-bin/ozone_rose.cgi

Options include:
- Station ID: Select one in-situ station from the list of IDs
- Rose Type: Select rose type. Ozone and Wind Speed have been discussed. (The clock roses will be discussed later.)
- Time Option: UTC or Local time
- Hour Interval: Default is "All Day" which shows all ozone observations between the dates. You can change the hour interval to look at 3 hour chunks of the day. This is useful to see ozone concentrations for different times of the day. For example, at Hawthorne pollution roses between 6:00-9:00 AM looks very different than at 3:00-6:00 PM


- Pot Range: This allows you to zoom in and out of the polar plot. The number selected will be the outermost percentage displayed.
- Begin Time: The beginning month, day, year, and hour.
- End Time: The ending month, day, year, and hour.
---- Some examples ----
This tool allows you to look at ozone concentrations and wind for different days at any station. Pollution roses for Hawthorne on each day of IOP 1 were quite different. On Wednesday, the air was clean when air blew from the south, and was dirty when it blew from the north-northwest. Thursday, however, had much more frequent winds from the south and south east with cleaner air.

---- Another View Point ----
Rather than plotting ozone concentration or wind speed frequency as a function of wind direction, another way to look at ozone concentration is as a function of time of day. I call this an "ozone clock." Imagine looking at a 24-hour clock with midnight at the top and noon at the bottom. Below shows the MTMET "ozone clock" for the month of June. As expected, ozone concentrations are most healthy (green) in the morning hours. The afternoon, especially 15:00, most frequently has the most polluted air because ozone is produced in the presence of sunlight.
NOTE: When creating plots like this for other stations, it is best to look at long periods of time (weeks to months), otherwise it may look as if a big bite has been taken out of the clock. The bit is caused when some hours have no wind direction reported. Ideally, the "clock" should roughly look like a circle because there are the same amount of each hour in a day (i.e. 3:00 AM occurs seven times in a week, as does 8:00 PM. In other words, each hour should occur 4.2% of the time). A wavy circle is caused when there are different amounts of observations for each hour during the period.
Send suggestions or comments about the interface to brian.blaylock@utah.edu
Subscribe to:
Posts (Atom)