The model is made of a grid. Inside each box the WRF model calculated values for temperature, pressure, wind, and other variables to make a forecast. This simulation has three nested domains each centered over Spanish Fork.
The first domain has 12 km grid resolution and is nested inside the NAM model.

The second domain has a resolution of 4 km.
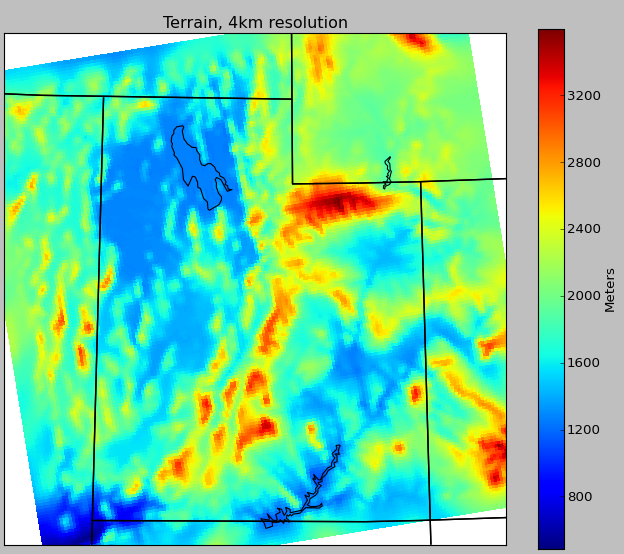
The third domain has a resolution of 1.33 km. You can see that as the resolution improves you can start to see all the details in the topography.

If you're familiar with Spanish Fork, 1.33 km is the distance from the Spanish Fork High School to the ballpark on Volunteer Drive. This is the length of each side of the grid box. Now you can see why weather models are kind of coarse--the forecasted weather is calculated once in the box, and we can see that only a few boxes would cover Spanish Fork. Also consider that this model is a higher resolution than the operational weather models the National Weather Service uses to issue forecasts. Why doesn't the National Weather Service just use weather models with better resolution? Well, that would take a lot of computer power that we don't have. Remember, this 24 hour forecast at this fine resolution took 17 hours to create.

Here are examples of the output (again, plotted in Python with Luke's code):
Dewpoint and Wind


Surface Pressure and Temperature


No comments:
Post a Comment
Note: Only a member of this blog may post a comment.