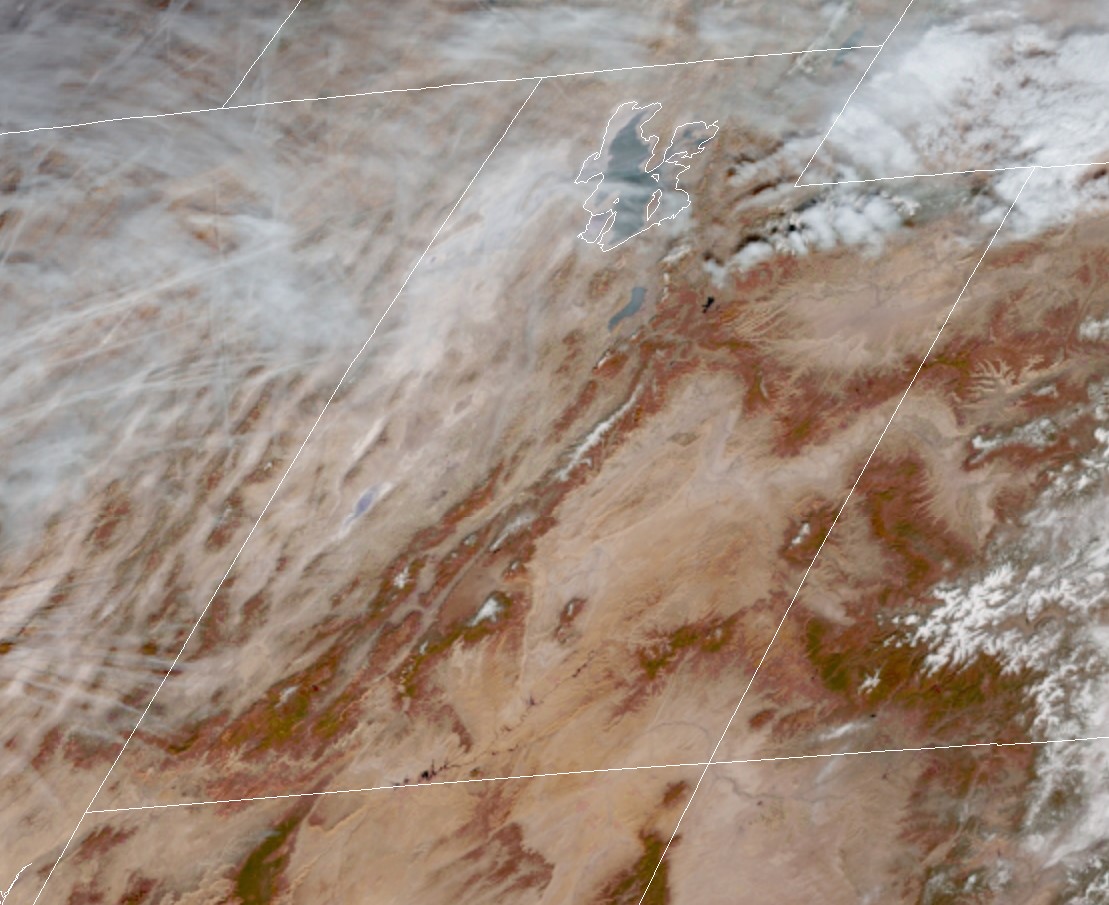
I created a True Color RGB image for all GOES-16 data files between 1800-1820 UTC for the month of September 2018. Then I plotted an image for different RGB percentiles. Looks cool.
Notice the differences between the 0th (minimum) and 1st percentile. Those dark spots are caused by cloud shadows.