There are four weather stations in Spanish Fork that make their data available via
MesoWest
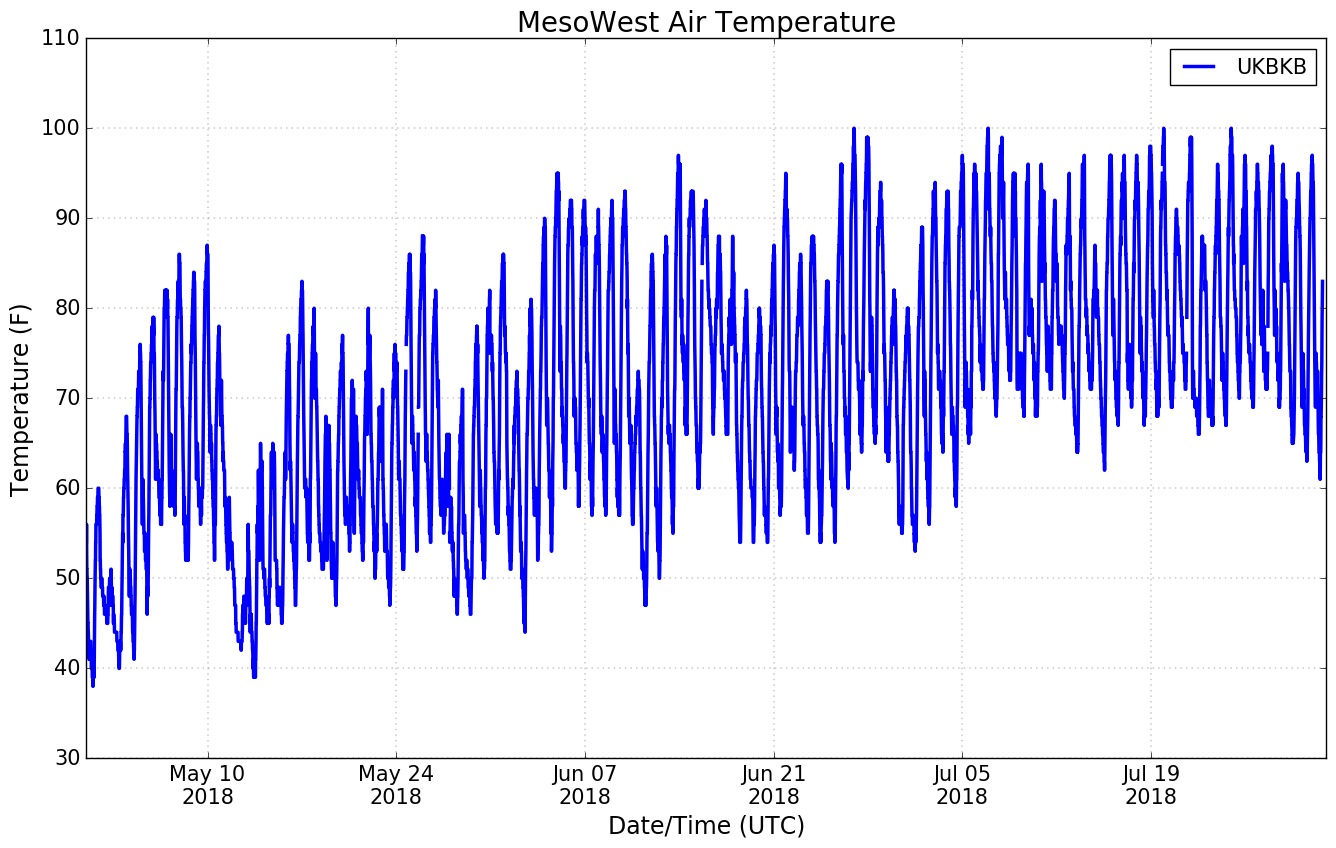
- UKBKB (also known as EW2355)
- My personal weather station (CWOP)
- Poor wind exposure. Shielded by houses.
- CW9348
- Another personal weather station (CWOP)
- Good wind exposure from the east. Houses to the west.
- UCC13
- Utah State University AgWx Net Climate Center
- Located in a field in the river bottoms. Generally good wind exposure. Mountain to the southeast.
- QSF
- Utah Division of Air Quality
- Located at the airport. I haven't seen where the instrument is installed, but I imagine it has good wind exposure because DAQ installed it.
Wind in Spanish Fork generally comes from three directions:
Southeast, from Spanish Fork Canyon - This is a thermally induced flow with often steady and consistent wind. Wind blows up the canyon during warm afternoons. Wind blows down the canyon in the night and early morning (generally stronger than the up-canyon flow). This consistent, and almost daily, wind pattern is why Wasatch Wind installed a wind farm in the canyon.
Southwest, prefontal - Strong southerlies that precede an approaching cold front. Temperatures are usually warmer than normal due to warmer air advected from the south. Often is very dusty.
Northwest, postfrontal - Strong northerlies that occur after a cold front has passed. Associated with precipitation and drastic decrease in temperature.
Wind Roses for Period of Record
UKBKB (March 13, 2013 - April 17, 2018): Yep, this station is shielded by the surrounding houses. Still, you get the sense that the wind direction that occurs most often is from Spanish Fork Canyon.
CW9348 (January 2, 2008 - April 17, 2018): Has same exposure issue as UKBKB. But still shows the canyon wind due to the good exposure on the east side (until they finish building the new neighborhood in the once-empty adjacent alfalfa field).
UCC13 (January 30, 2014 - April 17, 2018): Strongest winds from the southwest (prefrontal, before a approaching cold front) and from the mountains (thermally induced flow) out of the small canyon north of Flat Canyon. No indicator of postfrontal winds from the northwest, probably due to trees in that direction (another station siting issue). Or maybe the river bottoms just don't experience winds from the northwest because of the subtle elevation difference. I'm not sure.

QSF (June 10, 2004 - April 17, 2018): Nice wind exposure in all directions. This wind rose shows that wind direction is mostly oriented from the Spanish Fork Canyon (daily thermally induced flow). Winds can also be strong from the southwest (prefrontal) and from the northwest (postfrontal and possibly lake breeze from Utah Lake). It appears the storm systems are associated with the strongest winds (exceeding 20 MPH) experienced in Spanish Fork while the canyon flow is most regular. This station is so far away from Spanish Fork Canyon, that is it very likely that the golf course experiences much higher winds speeds from the southeast. I know is true from personal experience golfing the back nine before 10:00 AM.
Wind Events
Strong winds have blown over trees at Spanish Oaks Golf Couse, which is a problem for the course's grounds keeper, Dallin Naulu. For example, this spruce blew over near hole five on April 12, 2018. And my brother told me that there are broken tree limbs all over the river bottoms.
 |
| Hole 5 Spanish Oaks Golf Course. Photo credit: Dallin Naulu |
|
|
| Spanish Fork River Trail. Photo credit: Justin Blaylock |
April 12, 2018
The synoptic (large scale) weather condition was a deep upper level trough (low pressure) approaching Utah. Southerly winds were unusually strong for this time of year. Below is the HRRR weather model zero-hour forecast valid 12 April 2018 at 11:00 UTC (5:00 AM local). Black contour lines are the 500 hPa heights. Wind barbs indicate wind direction and speed (full barb is 5 m/s, half barb is 2.5 m/s). Pink shading depicts the area experiencing unusually strong winds for this time of the year. Specifically, it shows how much the 95th percentile wind speed is exceeded. [Side note: This is what I am actively researching, but related it to providing valuable information to wildfire managers].

Next is the same as above but zoomed in on Spanish Fork, and for 1200 UTC (6:00 AM local). Notice that the southwesterly wind before the cold front are exceptionally strong: 15-20 m/s (~30-40 MPH). These winds exceed the 95th percentile by 6-9 m/s (~15 MPH). In other words, for this time of year, these fast winds were unusually fast. [Again, this is currently my active area of research, and I'm still trying to learn how to interpret these results as it has never been done before].
That is all neat stuff, but it's from a weather model. The following are actual observations. All times are in local time. The blue line indicates wind speed, green dot is wind gust, and grey arrows points in the wind direction with wind speed proportional to it's length.
UKBKB and CW9348 are sheltered too much, but still observe wind gusts above 25 MPH.
The most interesting of the four stations is UCC13, the station in the river bottoms. It observed wind gusts of 50 MPH at 5:00 AM! Winds were strong and steady from the southwest between 2:00 AM and 7:00 AM.
QSF, near the airport, and other stations suggests the cold front passed around 6:30 AM when the wind suddenly shifted between southerly to northerly flow.
April 16, 2018
April 16th was another windy and very
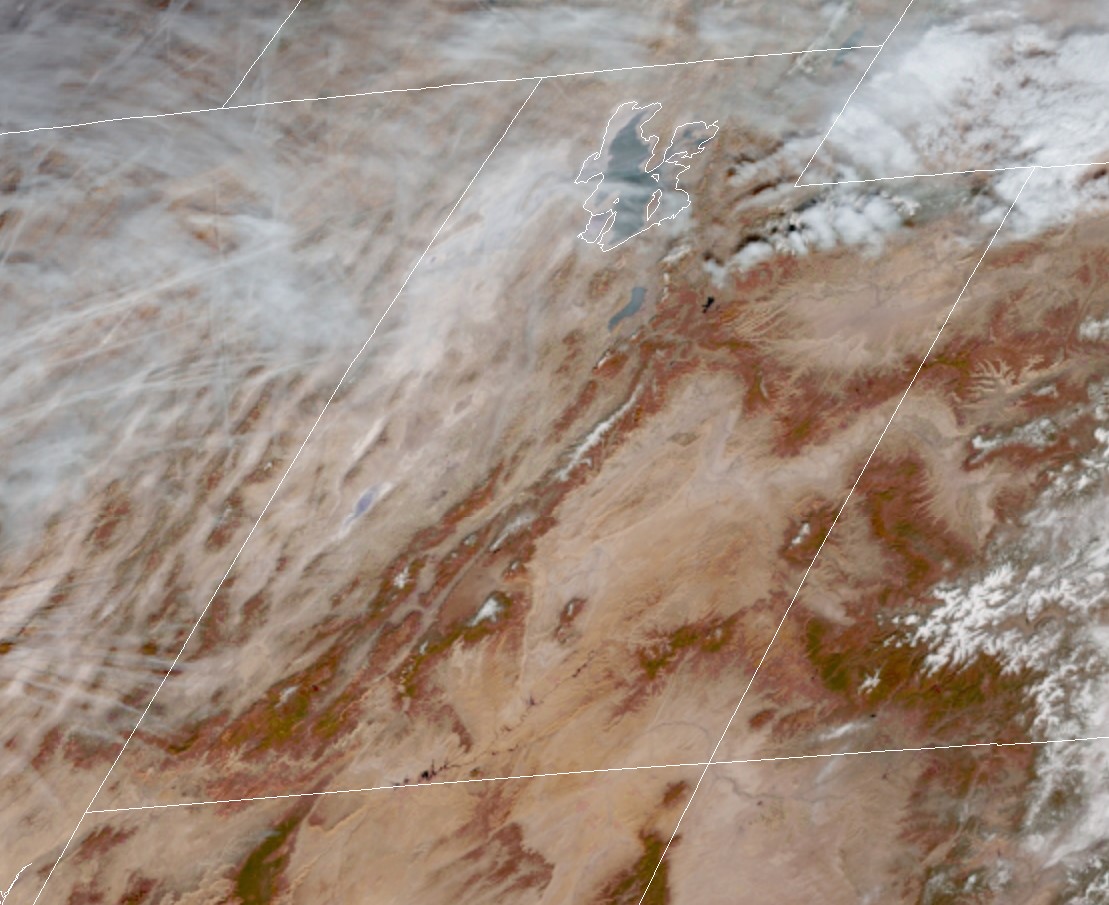
dusty day. How does it compare to April 12th? In many ways, it is very similar to the April 12th storm. From the HRRR analysis, a view of the entire United States at 0000 UTC 17 April (6:00 PM 16 April local time) shows a similar pressure trough in the 500 hPa height (contours). The ridge over the Midwest is amplified and there is a much deeper trough over the Great Lakes region than there was on April 12th.
The pink area over Utah again indicates where the winds experienced at this time were unusually strong for this time of year. One other difference is that the cold front on April 16th passed Spanish Fork in the early evening, a little after 7:00 PM local time.
Below shows the winds at the same time but zoomed in to Spanish Fork. Again, pink shades shows that this wind event was unusually strong for this time of year.
How about the observations?...
Again, UKBKB and CW9348 are a little boring because they are sheltered too much in the neighborhoods...
UCC13 again recorded the highest wind speeds in the river bottoms, with max gusts of about 45 MPH from the southwest.
QSF also recorded exceptional winds with sustained winds reaching 35 MPH (this station does not report gusts).
September 30, 2017
Dallin told me that September 30th was another windy day for the golf course. The weather on this day was fundamentally different than the two other cases.
Below on the left and right shows the HRRR model F00 analysis valid at 30 September 0900 UTC and 2300 UTC (3:00 AM and 5:00 PM local). In the morning (left) there is a large scale trough over the western states with a short wave ridge centered over Utah. In the evening (right image), the trough is more shallow than the previous two days. Also, the 500 hPa height gradient isn't as strong. Spacing between the height contours is related to the strength of the jet stream.


The figures below zooms in on Spanish Fork and shows the full resolution of the HRRR model (wind barb for every model grid point). On the left is 0900 UTC (3:00 AM local). On the right is 2300 UTC (5:00 PM local). Winds in Spanish Fork during the early morning were from the southeast. This type of flow is funneled through the canyon and can cause fast wind speeds, especially when forced by the larger scale synoptic flow, as what appears to have happened in this case. By the evening hours, a weak cold front passed bringing light winds from the north. Notice that there is no pink shading in the area which means the winds on this day are not ranked in the top 5% of fastest wind speeds for this area.


That said, the model shouldn't be taken as the "truth".
It is important to know that the model does not resolve the shape, depth, and size of Spanish Fork Canyon well. In the model, the canyon is overly smoothed. Because of that, we should expect different wind conditions at the mouth of the canyon near the golf course than the model simulates. So here are the observations for that day...
UKBKB and CW9348 observed the steady katabatic, down-canyon flow in the morning hours. Despite the sheltering of the neighborhood homes, max gusts were around 20 MPH. Winds typically blow down the canyon at night, so the additional forcing from the overall synoptic conditions are likely responsible for the enhanced canyon winds.
When wind blows out of Spanish Fork Canyon, UCC13 is sheltered by the mountains on the east. Thus, UCC13 does not observe strong winds in the morning during the canyon flow, and is not too useful at evaluating the conditions at the golf course during canyon flow. After the cold front passes, I suspect the winds from the north are blocked by the trees on the north. Winds at QSF after the cold front was 18 MPH but at UCC13 was only 3 MPH. Or maybe it is less windy in the river bottoms because the elevation is lower. I'm not sure what is going on here.
QSF observed the canyon flow in the early morning hours. Nothing terribly unusual.
Any wind damage at the golf course on September 30, 2017 was caused by a different weather pattern than the damaging winds on April 12, 2018. When we have strong southerly winds, I would speculate the back nine holes are sheltered while the front nine holes gets hit the hardest with gusty winds.
Even though there are four weather stations in Spanish Fork that are useful to evaluate wind events, the actual winds that occur at Spanish Fork Golf Couse can be different due to it's proximity to Spanish Fork Canyon. Better understanding of damaging wind events at Spanish Oaks Golf Course would require an additional weather sensor instrumentation near the mouth of the canyon or at the golf course. I imagine the nearby wind farm is heavily instrumented, but that data is proprietary and not available to the public.